How charities and non-profits can use data visualisations to better represent their data


For charities and non-profit organisations, it’s quite likely that you have large amounts of data that you’d like to demonstrate to your audience, whether that’s to show how a campaign has engaged with your audiences or to demonstrate your progress to stakeholders. If you’ve ever felt like your audience would struggle to make sense of this data in its current format, then a data visualisation could be the solution to your problems. There are a number of forms of data visualisation you can utilise to exhibit your findings in a more user friendly and graphically pleasing way. In this post, we’ll take you through some of the formats and a few of our favourite tools for creating them.
TLDR: Data visualisations are a way for charities and non-profits to represent large amounts of data in a more easily quantifiable and understandable way – here are some examples of our favourites and the tools we use to create them.
What are data visualisations and how are they useful to charities and non-profit organisations?
Data visualisation is a method of representing data through the use of graphics. These can be in the form of charts and graphs, interactive maps or infographics. It’s a way to display large amounts of information with potentially complex data relationships in a way that’s quickly and easily understood. When you’re writing a report to establish your expertise or as a project show and tell, adding these in for some visual, easy to comprehend means of highlighting your work assists in bringing your readers along for the journey. They’re also a great way to display how your work has helped the people and/or things you support.
Flourish, a tool we use to put together data visualisations for our clients (read on for more on this), has some good examples of how non-profit organisations they’ve worked with have produced visualisations for things like bringing impact journeys to life with interactive storytelling and revealing interesting patterns through population pyramids.
Graphical visualisations like this also give the audience the opportunity to draw their own conclusions about the data you’re presenting. They can be tailored to fit with your branding, as well as supplementing articles and data heavy documents.
“Data visualization is useful for data cleaning, exploring data structure, detecting outliers and unusual groups, identifying trends and clusters, spotting local patterns, evaluating modeling output, and presenting results. It is essential for exploratory data analysis and data mining to check data quality and to help analysts become familiar with the structure and features of the data before them.” – Harvard Data Science Review
Some of the main purposes of making use of data visualisations include showing change over time, looking at how data is distributed across a set of values, comparing values between groups, observing the relationships between variables, looking at geographical data, and examining the relationship between a portion of an element and the entire thing: in essence, looking at how a specific part of something relates to the complete set/quantity (‘part-to-whole’ comparison) [Atlassian].
Ultimately, they assist in unlocking key values and identifying patterns within your data sets. Because they’re visual in nature – and generally more attractive than a large set of numbers or data points – graphical visualisations can be far more engaging to a wider audience, if done correctly.

How to choose the correct type of data visualisation to suit your needs
If you’re wondering how you might choose the best form of graphical visualisation to represent your data, it’s a good idea to look at what different types of visualisation are available so you get an idea of what they can do for you:
- Charts: Charts are a way to condense large amounts of data into an easy to understand format that’s scientifically proven. They’re designed to make it easier to understand things like trends, patterns and relationships within a data set. These include pie charts, bar graphs, line graphs and X/Y plots
- Maps: Map data visualisations display data in a way that demonstrates how it’s linked to specific geographic locations. Rather than showing individual data points, they group data by regions – for example: neighbourhoods, states/counties, countries, and even continents. Grouping data in this way makes it far easier to analyse how the data varies across areas.
- Infographics: More formally known as ‘information graphics,’ infographics use either one or several data visualisations to tell a story about a specific topic, alongside other complimentary visuals. They can include charts, timelines, diagrams, tables, lists and text to help them do this.
- Statistics and counters: Statistics are mathematical methods of summarising and analysing data, whereas counters are used to display and track numerical data points and provide a quick overview of specific metrics, often in real-time.
- Scrollytelling: A way of transforming a longer form story into a more interactive experience. This can have both audio and visual elements that add a deeper meaning and capture what words alone cannot. They make use of ‘one-page’ website design to keep the audience engaged, as the narrative progresses while they scroll down the page.

Once you’ve decided upon the type of data visualisation you wish to create, there are a number of steps to keep in mind: You should*:
- Define a clear purpose for your visualisation (i.e. what do you want it to do or represent?)
- Understand the audience you wish to communicate with
- Ensure your visualisations are simple and not unnecessarily complex
- Choose the right visual/type to best represent your data
- Make sure your visualisations are inclusive for everyone who views them
- Provide additional context to help build understanding
- Make them actionable (e.g. have a ‘call to action’ or a way for users to take further steps with the data)
- 7 steps of data visualisation (Fontbonne University)
To best make use of the data visualisations you choose to represent your data, Senior Business Analyst, Nicholas Lowthorpe, also created a guide called the 5 C’s of data visualisation: these ask if your visualisation is clear, concise, consistent, correct, and compelling, offering a guide on how data should be presented so that it’s easily understandable for your audience, and to ensure they find it trustworthy and impactful.
Data visualisations are especially useful to charities and non-profits, as they provide a way to display a number of aspects of their work: they allow you to demonstrate your progress in your chosen field, and highlight the impact you’re having around your strategies, goals and annual reports. They can also be used in map form to emphasise issues on a global scale. For one of our clients, the platform we created empowers them to create visualisations to report in real-time on global conflicts, something that’s particularly timely at the moment, with both the wars in Israel and Palestine, and Ukraine.
Some of our favourite data visualisation tools
D3
This is a very technical open-source library that enables developers to create custom data visualisations via a convenient toolbox of modules. We used this library to assist in the UN Sparrow project, collecting data from X (formerly Twitter) to output highly visual and interactive charts that respond to report changes in real-time. This helped us to create high-quality, brand focused reports based purely on user data.
Chart.js
Similarly to the tool above, Chart.js is also more developer focused. It allows you to build clean, modern looking charts that include advanced animations, making them more interactive for your audience. It’s also open-source, performant across all modern browsers and is very responsive.
For non-developers, there’s a tool called QuickChart that uses Chart.js to create charts for their website, reports or presentations. This requires no coding knowledge and the charts it produces are highly customisable and embeddable anywhere.
We put QuickChart to good use for our LEAP Lambeth project – this gave them the ability to take advantage of the power of Chart.js, without needing a technical background, to build their own charts. To build an in-house learning and development platform for Nurture, we used Chart.js to map the progress of individual learning activities, providing team members a history of their completed tasks.

Flourish
Excellent for storytelling, Flourish is a non-code tool that transforms raw data into fully interactive visualisations; it can also be connected to third-party data sources easily, a great solution for more complex visualisation requirements.
We used this as part of the International Agency for the Prevention of Blindness (IAPB)’s Vision Atlas project to allow their team to control the general setup of their charts. Then, we built our own custom data connection to Knack (another no-code tool, this time a database app builder) to ensure we could manipulate data in real-time – based on user filters – and translate the content dynamically. Flourish also gives users the option to download the charts as images, which can be used as part of reports and presentations.
Mapbox
We’ve used Mapbox on a number of our client projects, including our Girls Not Brides Child Atlas, Consortium for Street Children Legal Atlas, and the IAPB Vision Atlas home page. It’s a fantastic GIS (Geographic Information System) service for visualising geographical data, such as heatmaps, highlighting data over regions, and showing markers and pins in specific locations. As well as being graphically pleasing, we’re also able to customise these maps to match in with clients’ branding, making them entirely bespoke to them.
The custom features of Mapbox give us options to depict client data in specific ways, for example: on the IAPB Vision Atlas, we used a feature that showed the prevalence of sight loss as standardised by age as a heat map (see below).

Bespoke charts
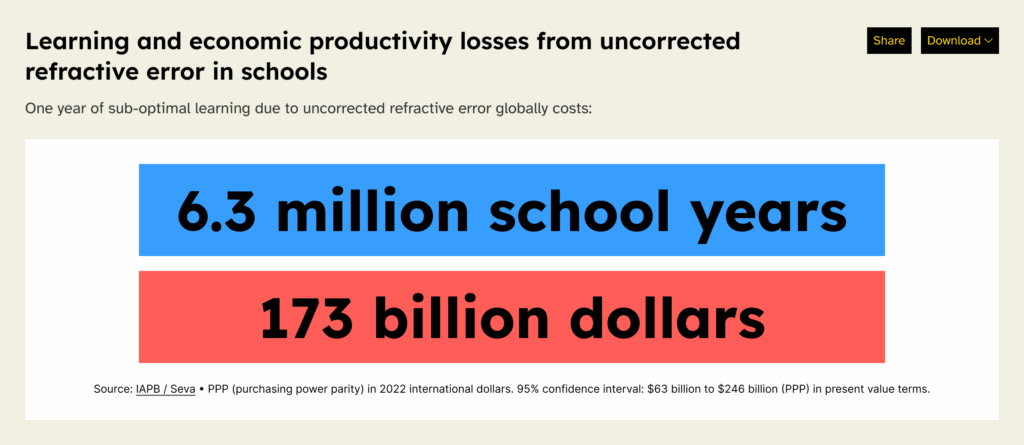
For times when a pre-existing service doesn’t quite provide the options we require to best represent our clients’ data, we also create bespoke visualisations that are more suited to their needs. All of the visualisations used within the UN Sparrow project are custom built by us. We also built bespoke visualisations as part of the IAPB Vision Atlas for their stat counter and comparison tables (see examples below).

In summary
There are some amazing ways in which charities and non-profits can demonstrate things like the success of your organisation’s work, global prevalence of a particular statistic, or progress on a project using data visualisations. They are beautiful examples of making data accessible to your audience, and also of sharing the data and making it available to use. Why not get in touch to see how we can help you represent your data in the best possible way?
